If you are familiar with Automotive NVH, or any area of Noise, Vibration & Harshness Engineering, you will likely have heard of order tracking. Order tracking is most commonly used for rotating or reciprocal machinery with varying operational speeds – such as engines, transmissions, prop shafts, differentials etcetera. But what exactly is it, and why do we use it?
To give an example, imagine a fan system with 8 blades. We know that there will most likely be a tonal component of the noise at the blade-passing-frequency (BPF). As there are 8 blades, the BPF can simply be calculated by: fan RPM * 8. If the fan was to run at a constant speed, then it would be very simple to run an FFT calculation of measured noise levels during operation. The BPF would present as a peak at the calculated frequency, and we could assess the level of tonal noise generated as a result.
However, what if the fan ran at variable speeds? Running a simple stationary FFT would result in smearing across the frequency range, as the BPF moves throughout the spectrum and inaccurate results would result.
This is where order tracking comes in. As we know the relationship between BPF and RPM is linear, if we can measure the fan RPM, we can simply multiply the result by 8 to get the BPF. We can then use this calculated BPF to filter out all acoustic signals which are not related to the blade passing tone. This is effectively how order tracking works for automotive NVH.
The key element to order tracking is access to a reliable RPM trace. This can either be via CAN, CAN via OBDII, tacho output or even from an acoustic / vibration signal (as discussed later).
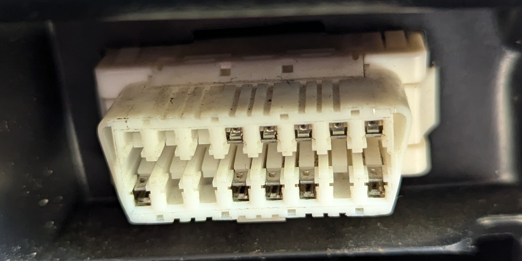 A typical OBDII connector
To further demonstrate the use of order tracking, the following section of this blog post discusses the measurement of engine orders within a vehicle cabin.
This test was conducted on a 24MY Toyota Rav4, with microphones located at the driver ear locations. An engine RPM trace was recorded from the OBDII port (which transmits CAN data). A stationary engine RPM was then conducted, with synchronous acoustic measurements from the vehicle cabin microphones and CAN data.
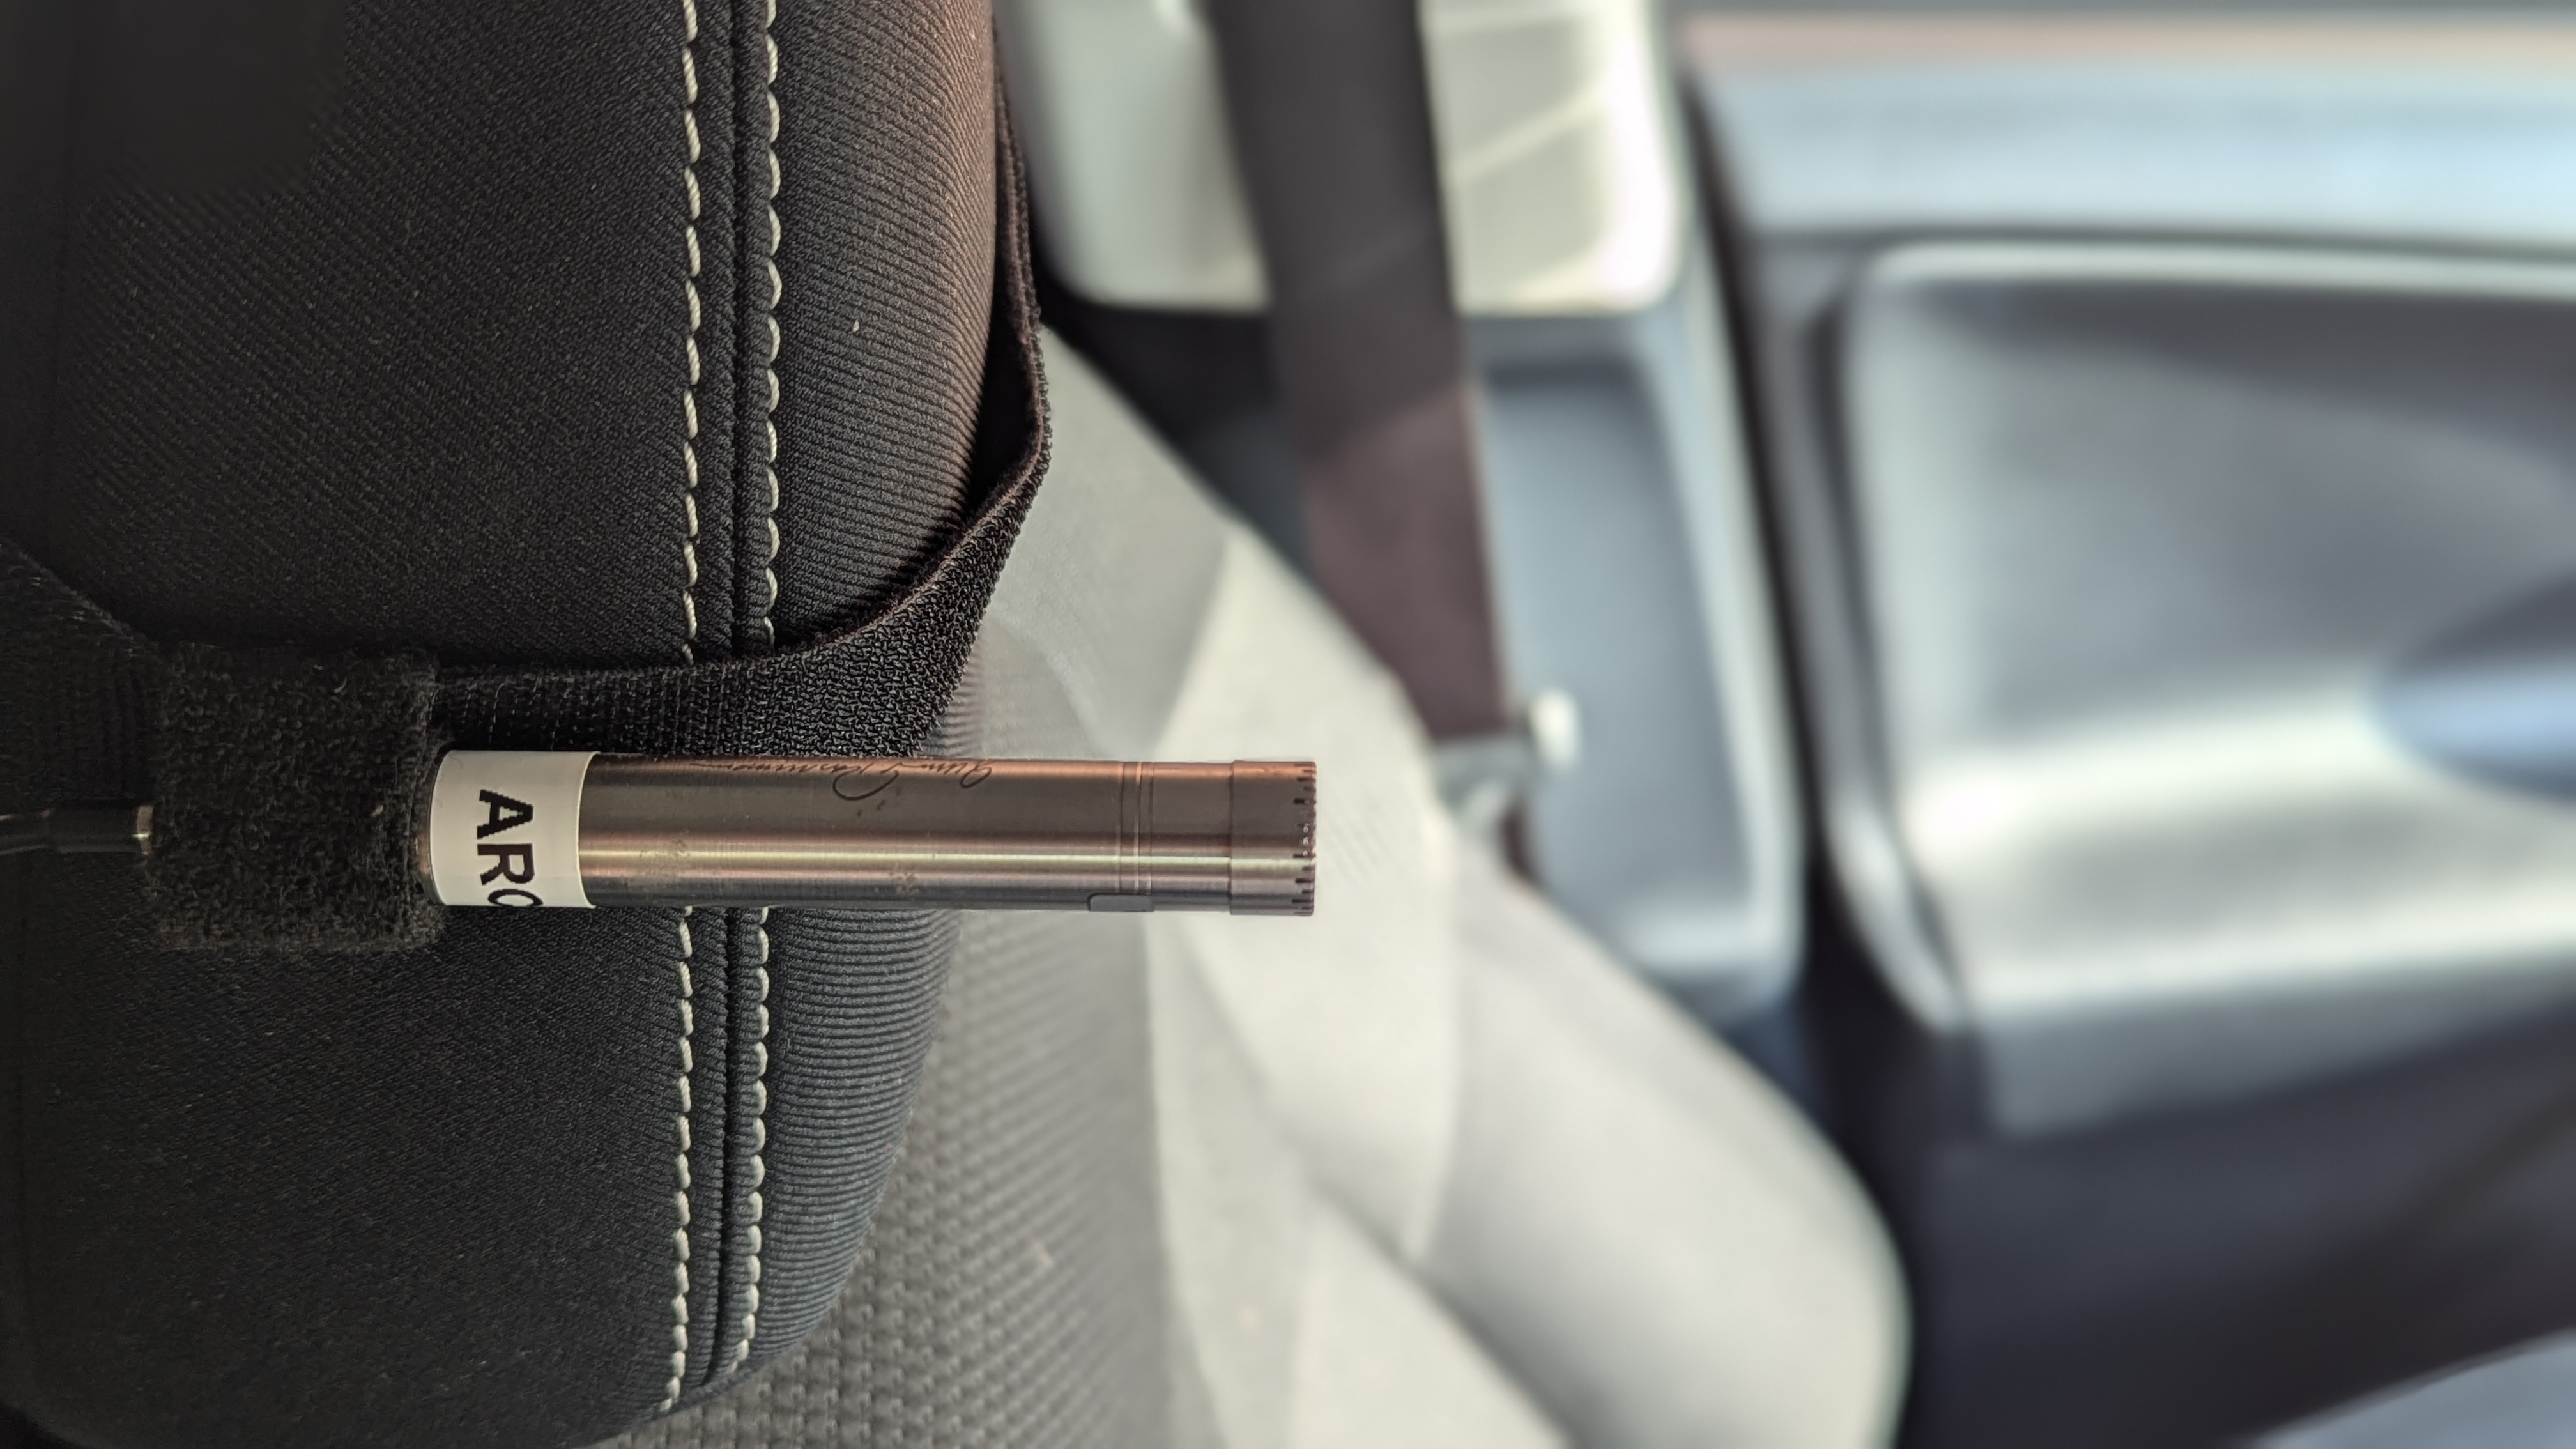 Cabin interior microphones (GRAS 46AE)
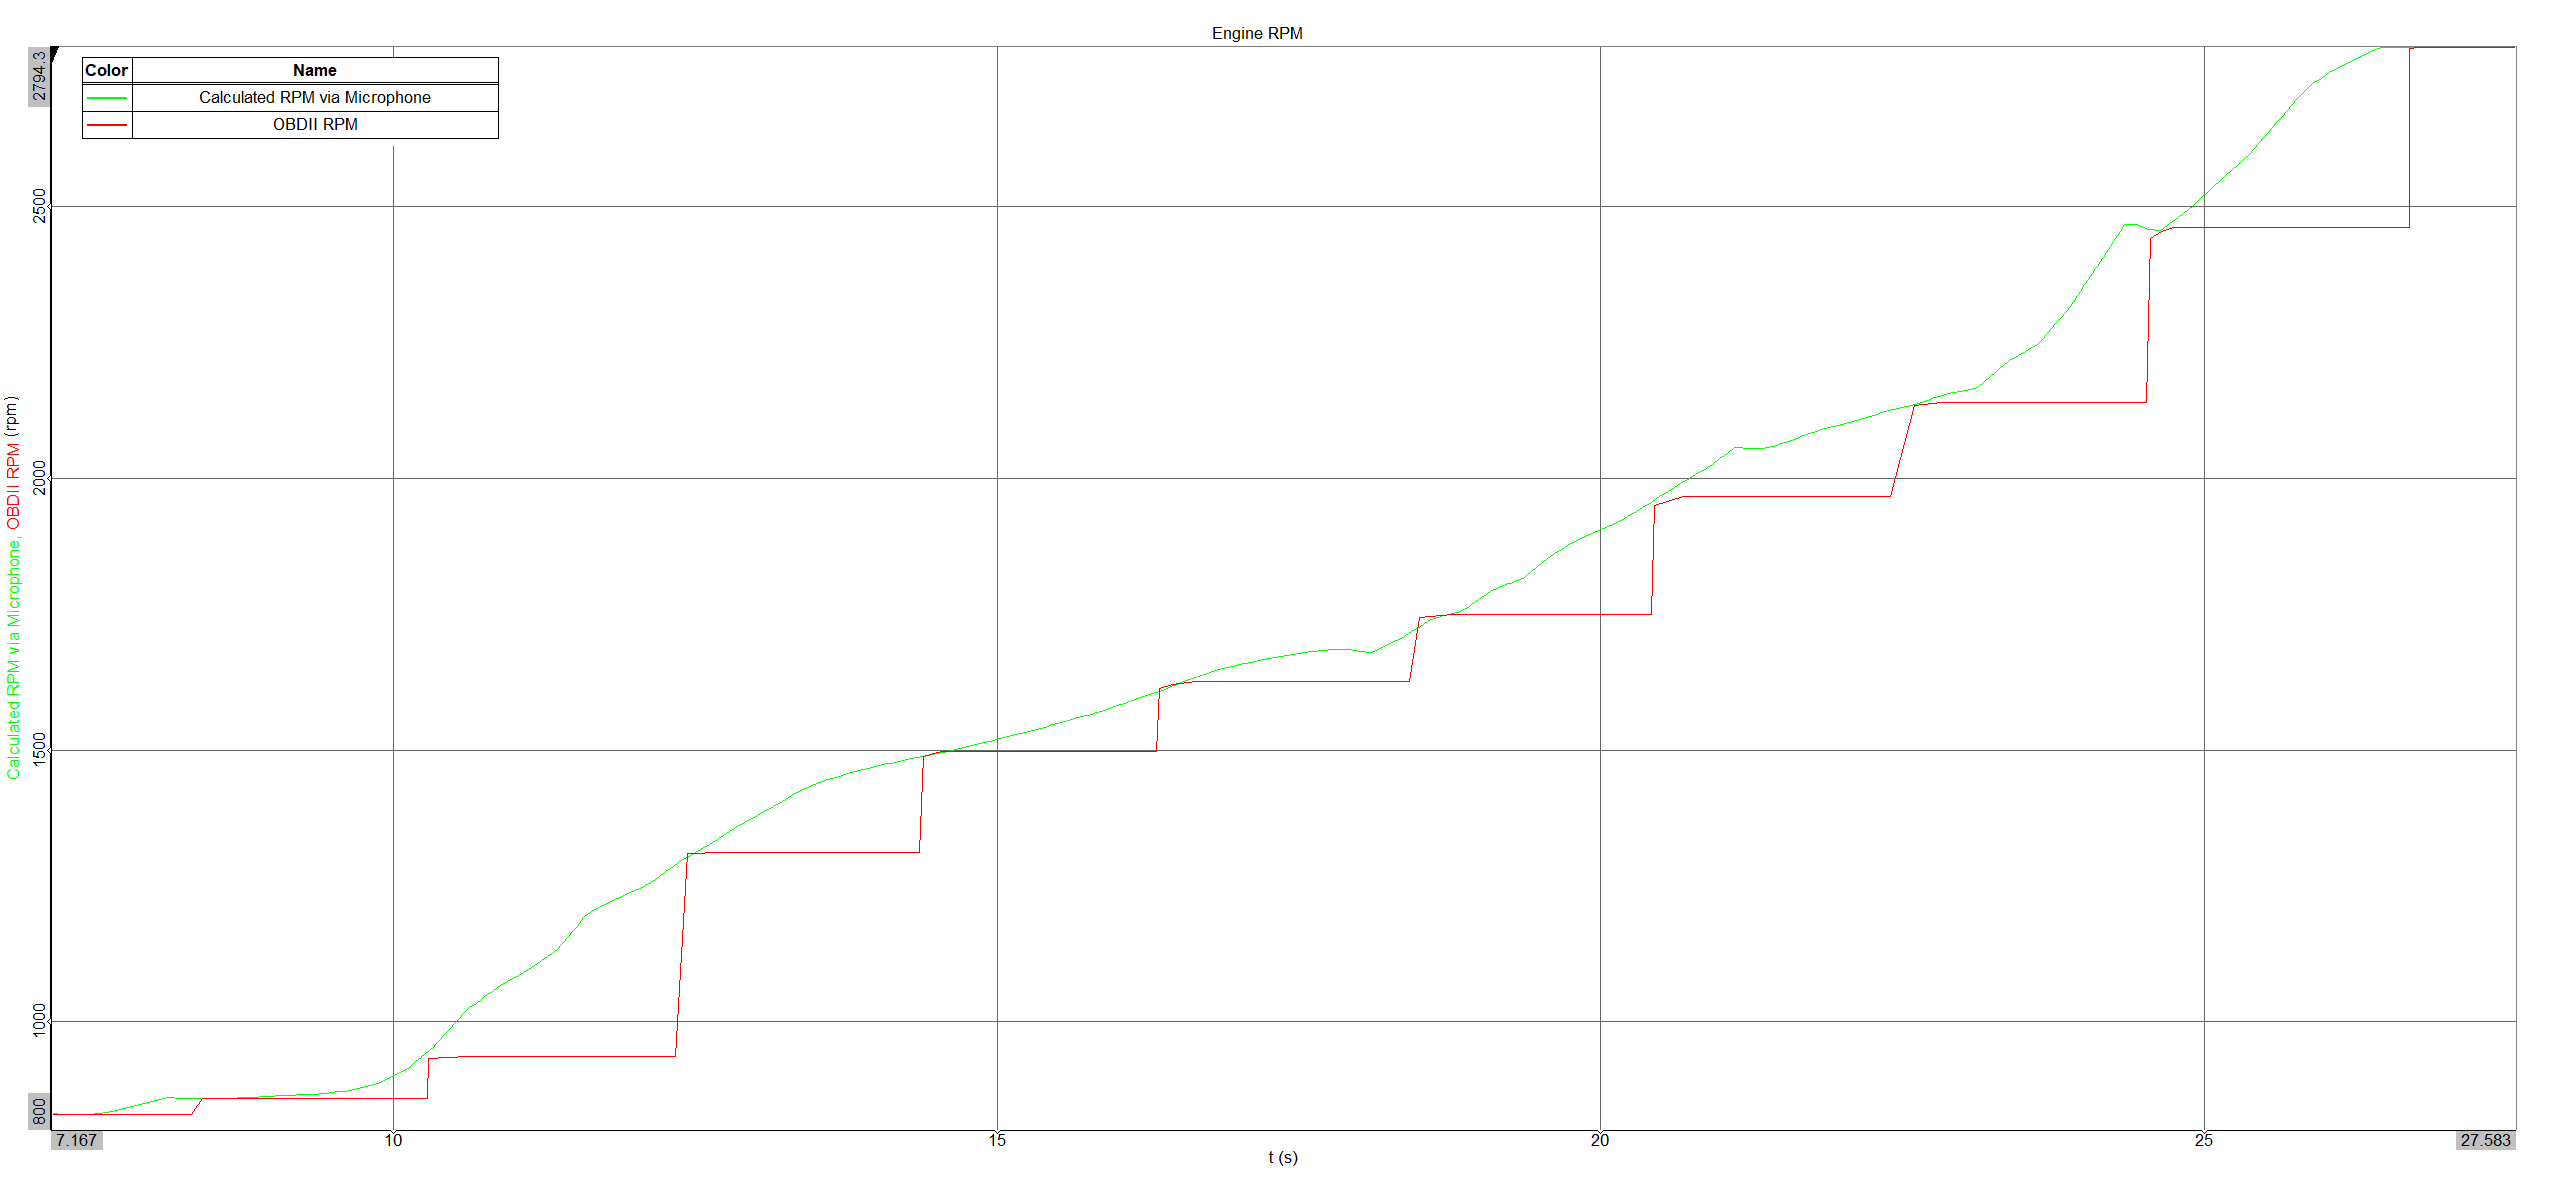
The main issue with using CAN via OBDII is the low temporal resolution / sample rate. In this case, the OBDII port provides a sample rate of 0.5Hz, or 1 refresh every 2 seconds, which clearly is not ideal. Another method of defining an engine RPM trace is to use an acoustic or vibration sensor output – such as the vehicle cabin microphones. As the vehicle has a 4-cylinder engine, we know that second order will be dominant (2 combustions per engine revolution). We can therefore look at the microphone signal, apply some filtering, and calculate the dominant frequency. Once this is divided by 2, we should arrive at the engine RPM.
The image below shows the OBDII vs microphone calculated engine RPM. As you can see, the microphone calculated signal provides much better resolution.
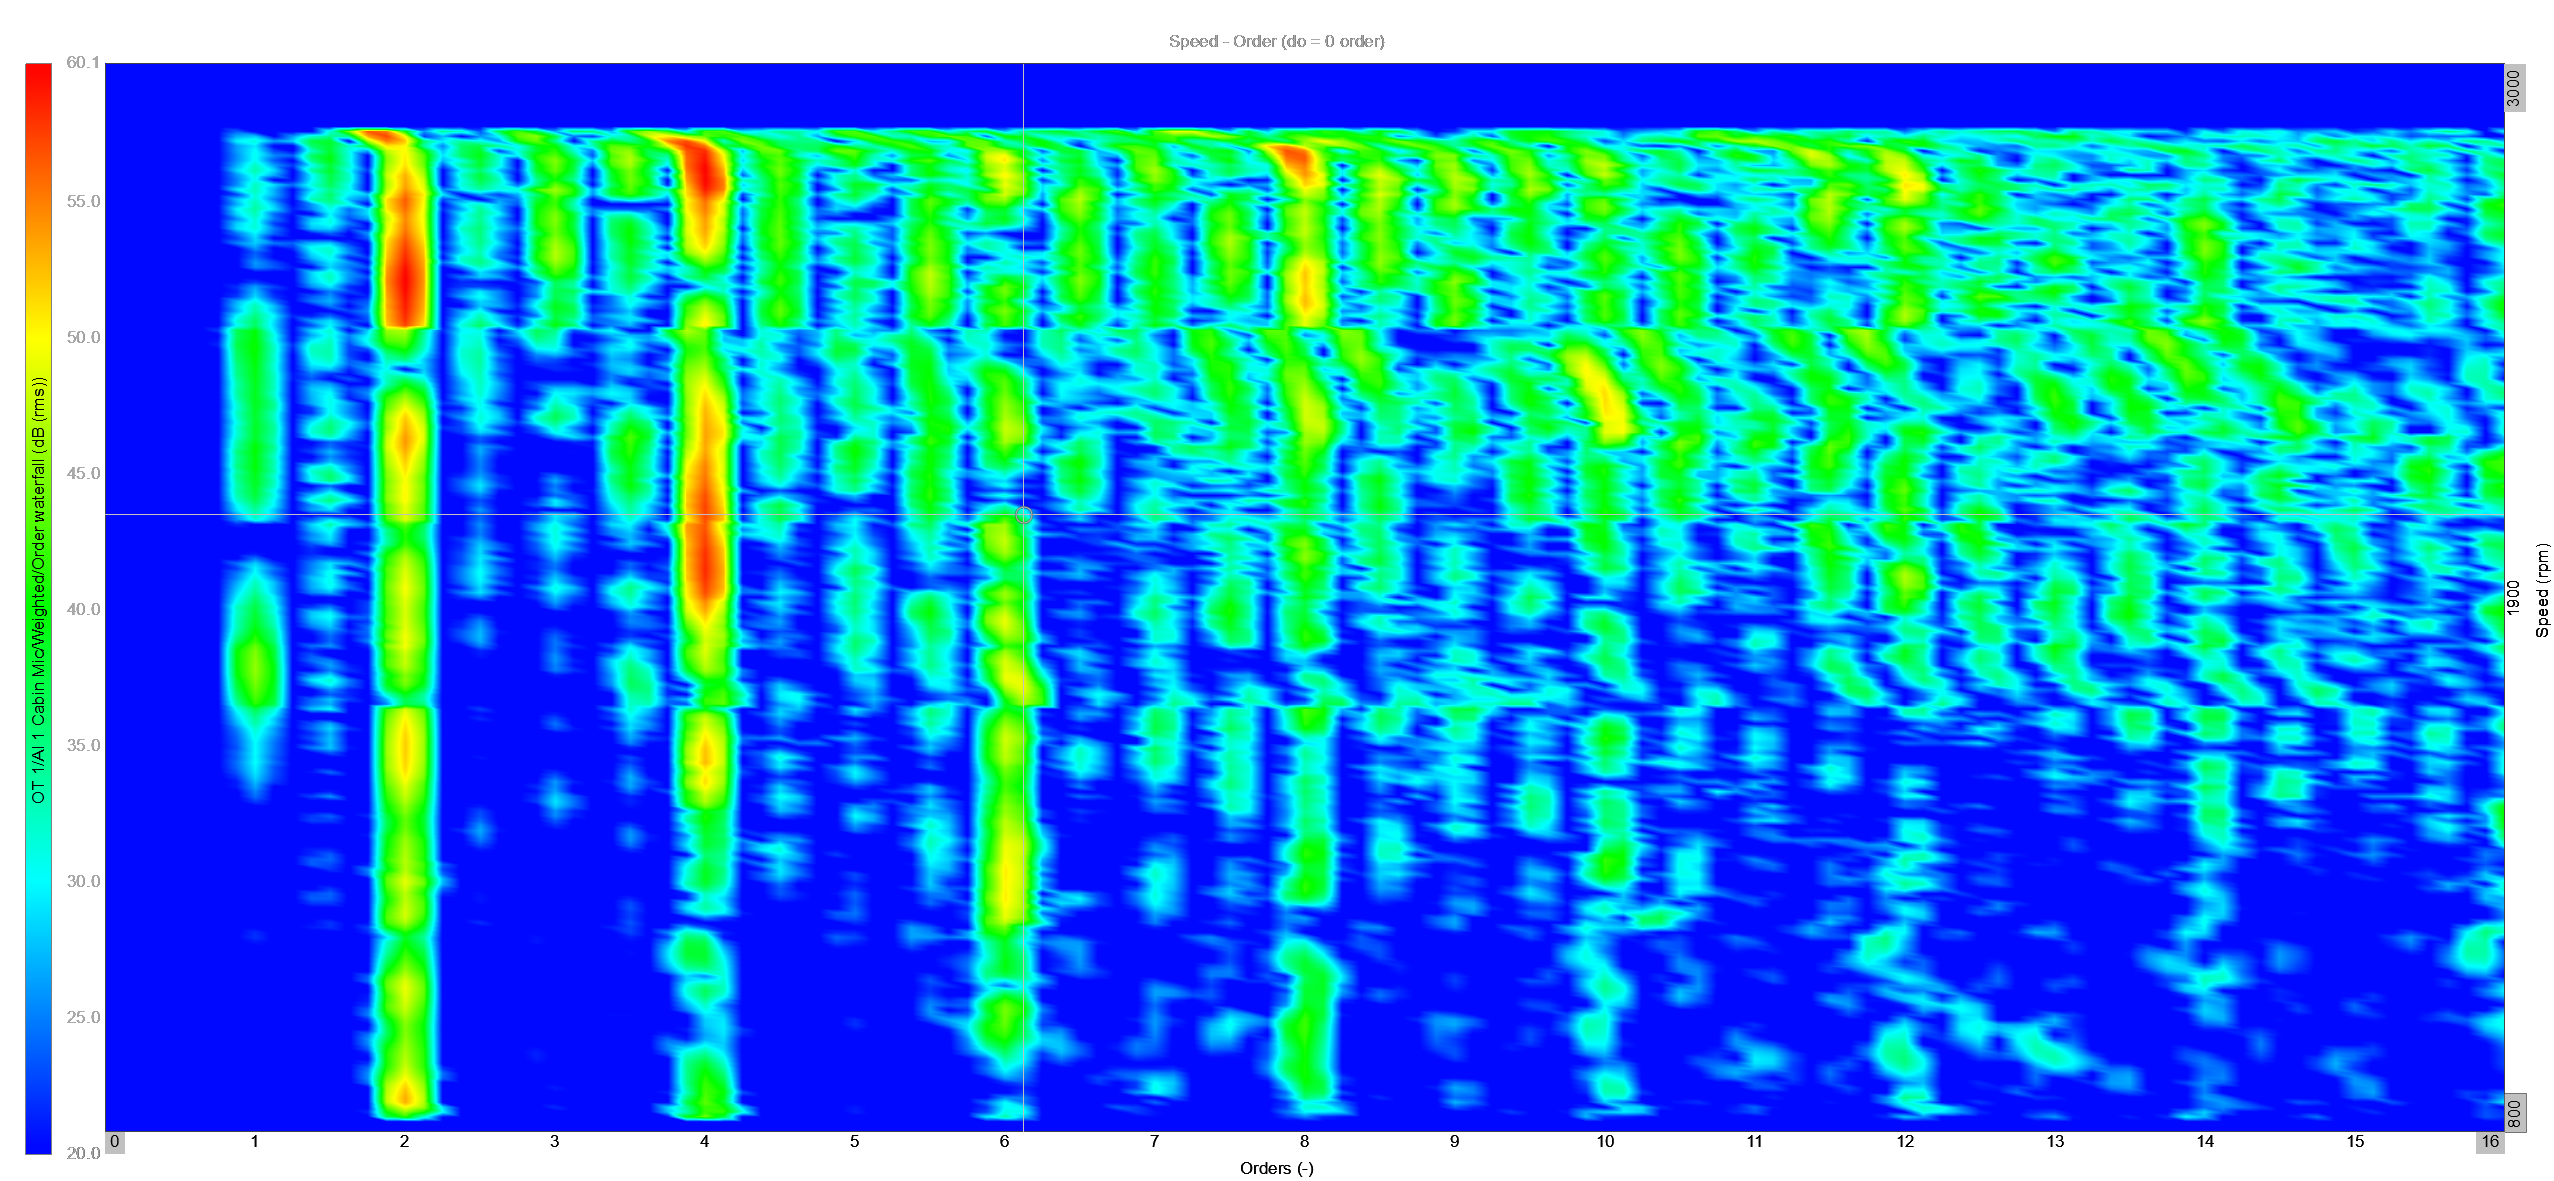
Once the engine RPM is defined, we can calculate the orders dominant within the cabin across the RPM range.
The results are shown in colourmap format below. As you can see, there is significant contribution from 2nd and 4th engine orders (usually written 2e and 4e). We can also observe at which RPMs each order is most prominent. For example, 4e has high acoustic excitation levels from 1900 – 2300 RPM, while 2e reaches peak excitation at higher RPMs.
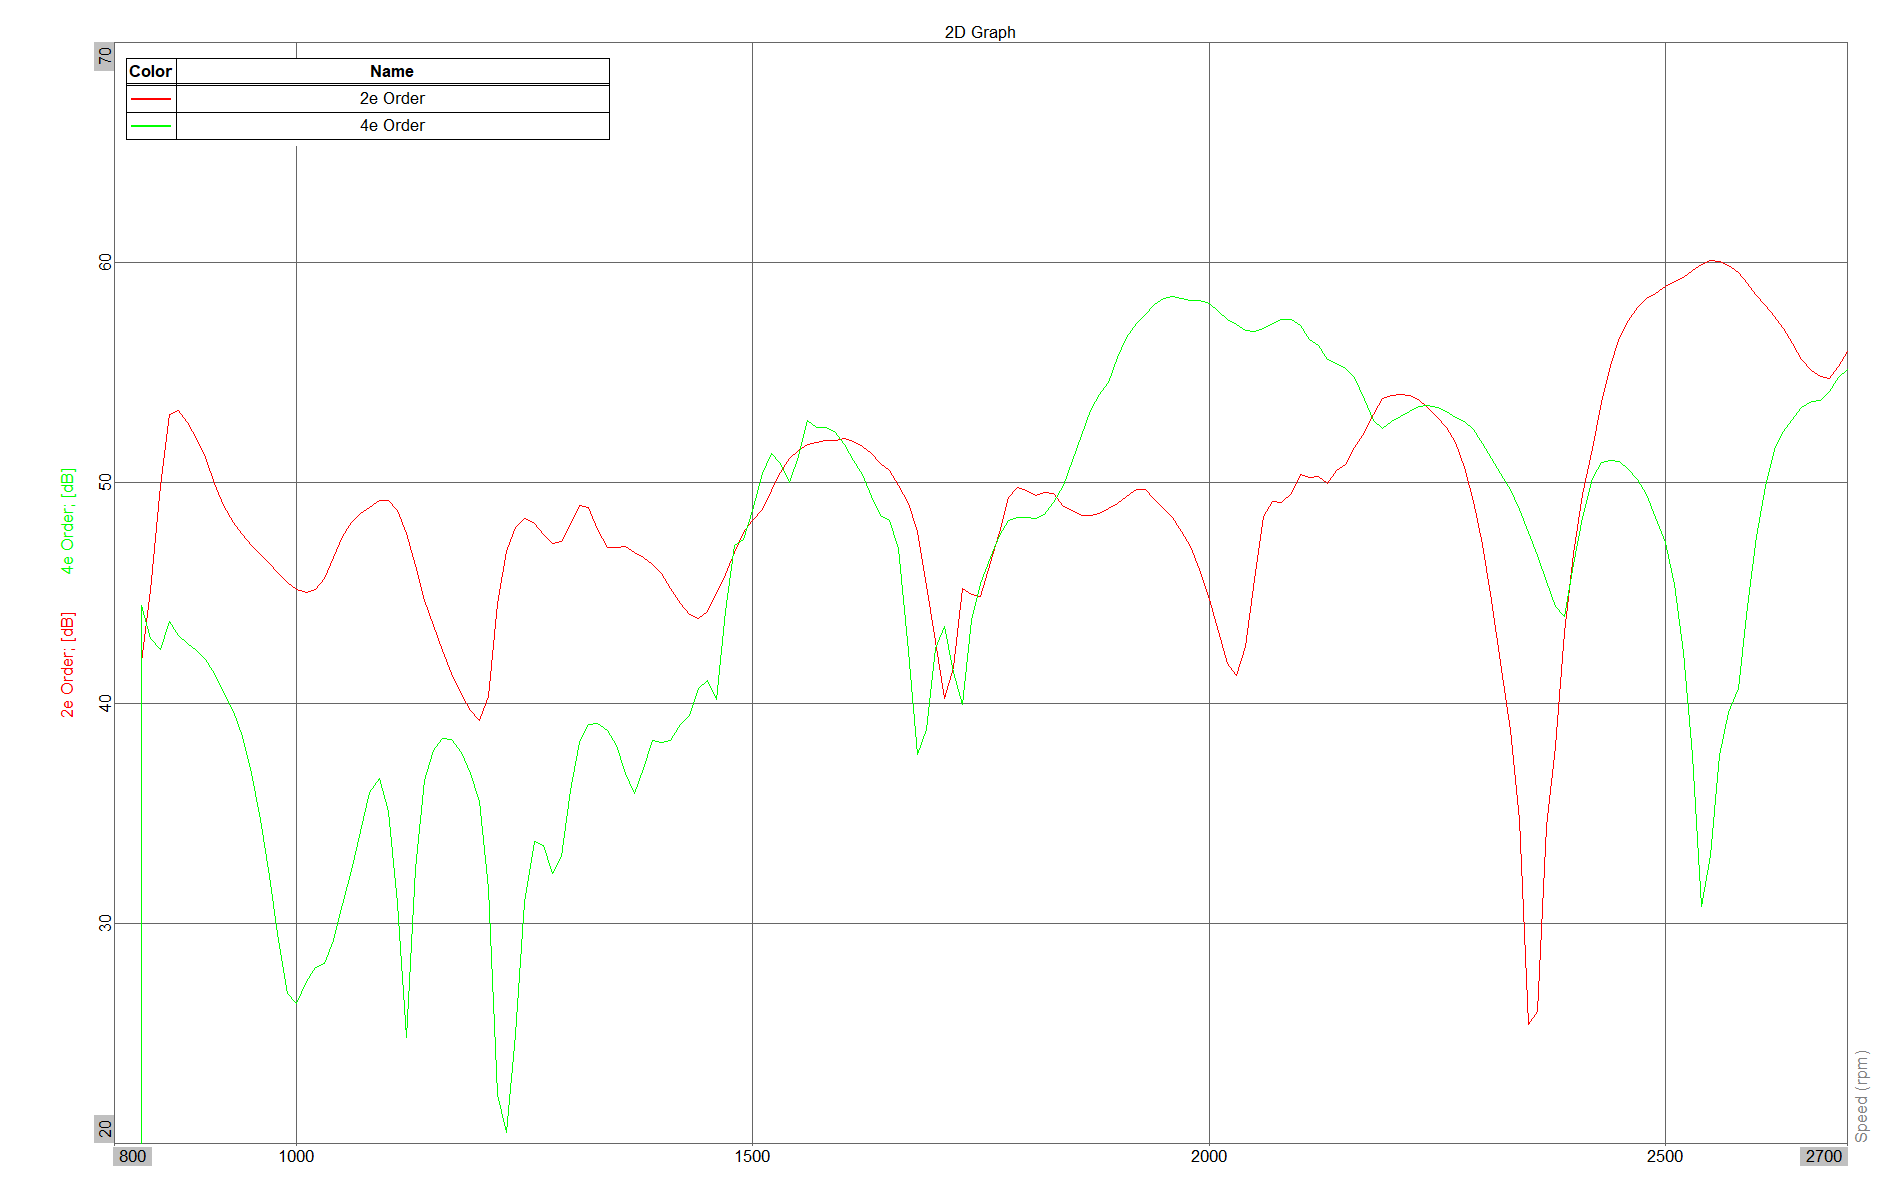
We can also view this on a 2-dimensional plot, as shown below. This allows us to understand the order contribution over the RPM sweep. The plot below shows 2e and 4e versus engine RPM.
We hope this has given a brief overview of the use of order tracking. In other applications in can be used to assess gear meshing frequencies, out-of-balance forces and even audio system assessments, and it is a key component of the NVH Engineers toolbox.
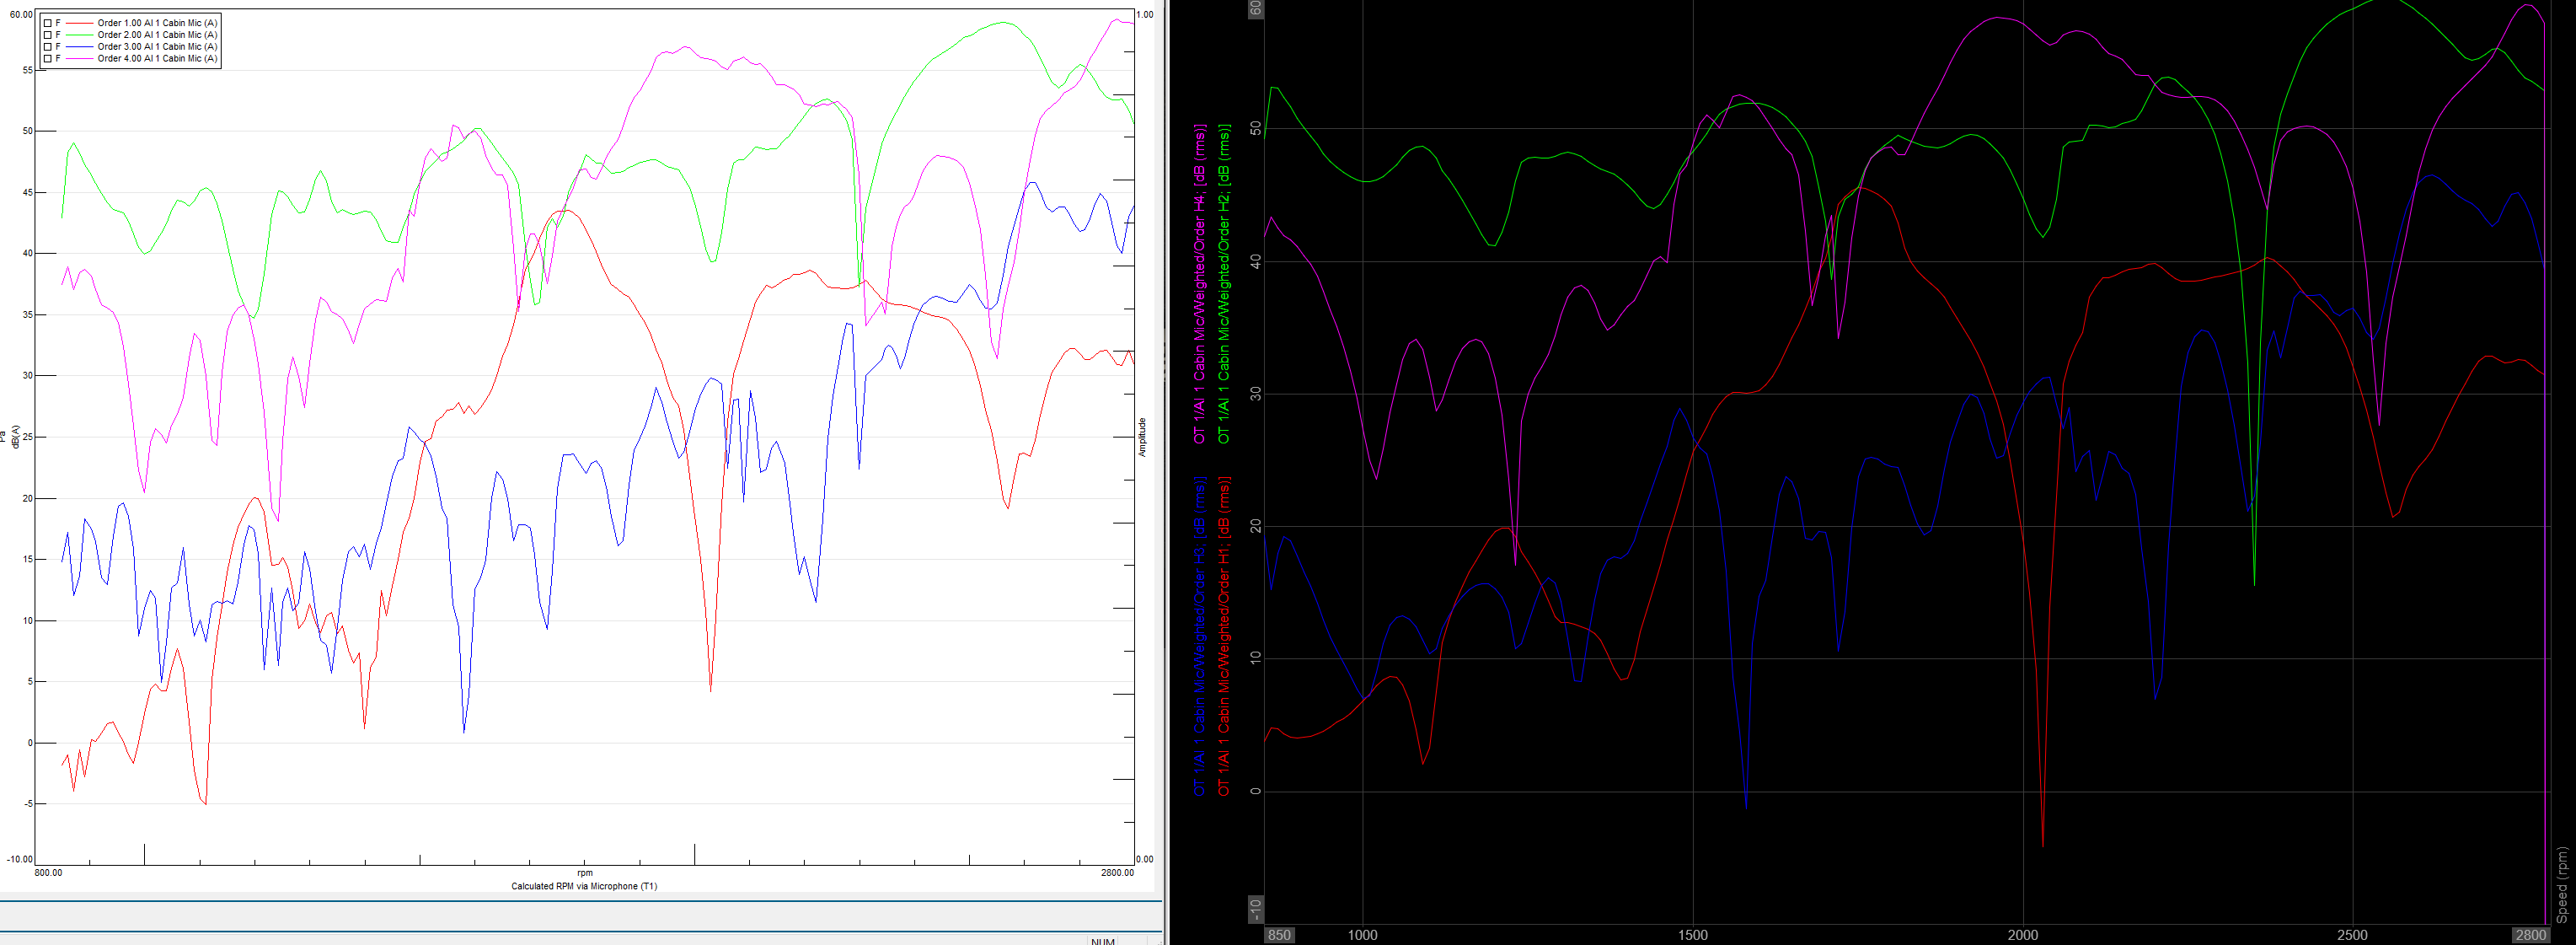
At ARC, we use a combination of Dewesoft and Siemens LMS / TestLab hardware and software, so it is always interesting to compare the results between the two manufacturers. As you can see in the plots below, the two provide a good level of correlation in terms of Order Tracking analysis.
If you feel ARC can be of assistance to your NVH projects, then please feel free to contact us.
PINNED POSTS
No data found
BLOG CATEGORIES
No data found