Welcome to the first in a series of NVH Benchmarking blog posts. This week, we will be showing limited results of our acoustic benchmarking campaign on the 23MY VW T-Roc. Full results are available to our clients, along with bespoke vehicle benchmarking requests and NVH development services.
The typical ARC NVH Benchmarking campaign would usually consist of the following:
• Audio System Frequency Response Function (FRF)
• HVAC Noise & Psychoacoustics
• Cabin Reverberation Time (RT60)
• Cabin Isolation
• Engine Idle Noise & Vibration
• Powered Ancillaries SPL & Psychoacoustics
• Powered Ancillaries Tactility
• Powertrain Noise & Vibration
• Wind Noise
• Road Noise
• Ride Comfort
• Door Slam Sound Quality
• Mounting Point LDS, ATF and NFT
• Modal Analysis
As this is a set of limited results, we will look at a few of the acoustic characteristics of the VW T-Roc below.
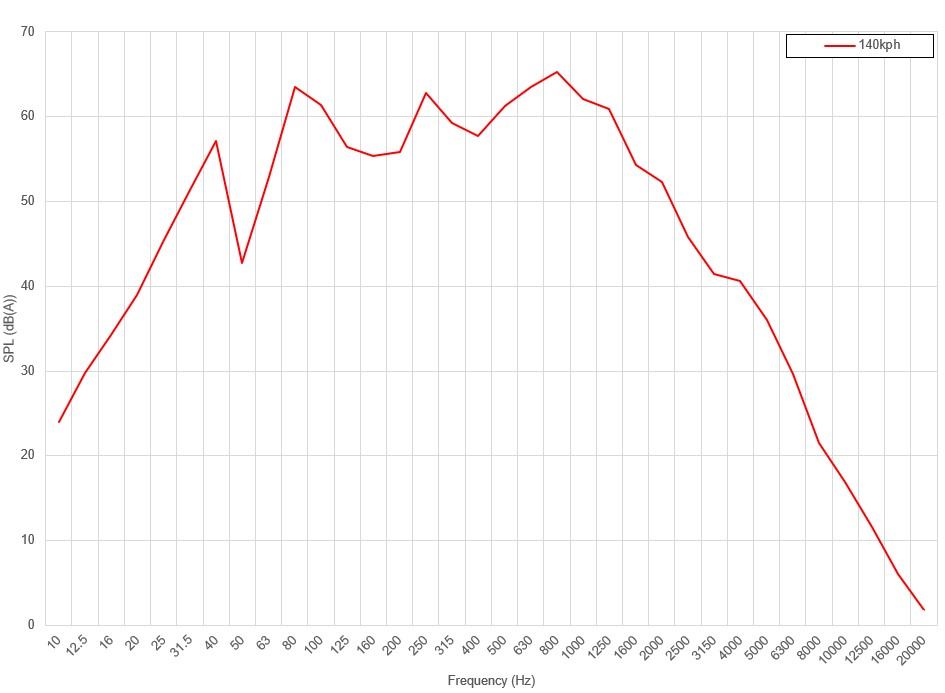
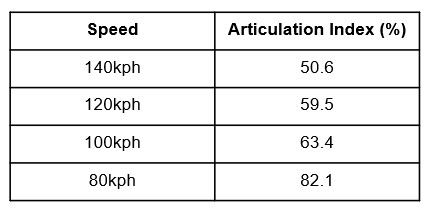
Wind Noise:
For assessment of wind noise, measurements have been taken at passenger ear positions, with the vehicle travelling at speeds of 60kph, 80kph, 100kph, 120kph & 140kph. Generally, the post processing of this data includes an assessment of one-third octaves (CPB) and Articulation Index (%).
The figure below shows the one-third octave spectrum at 140kph – this is the energetic average across the front four ear positions.
You can also see the Articulation Index results below:
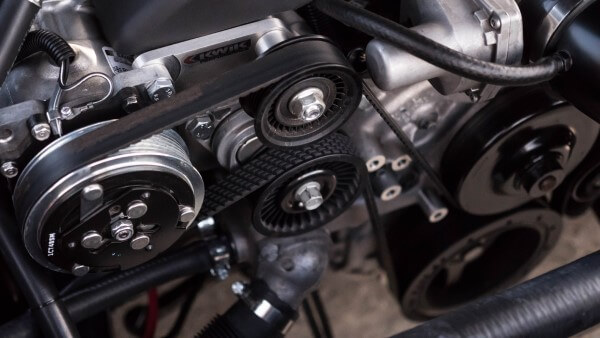
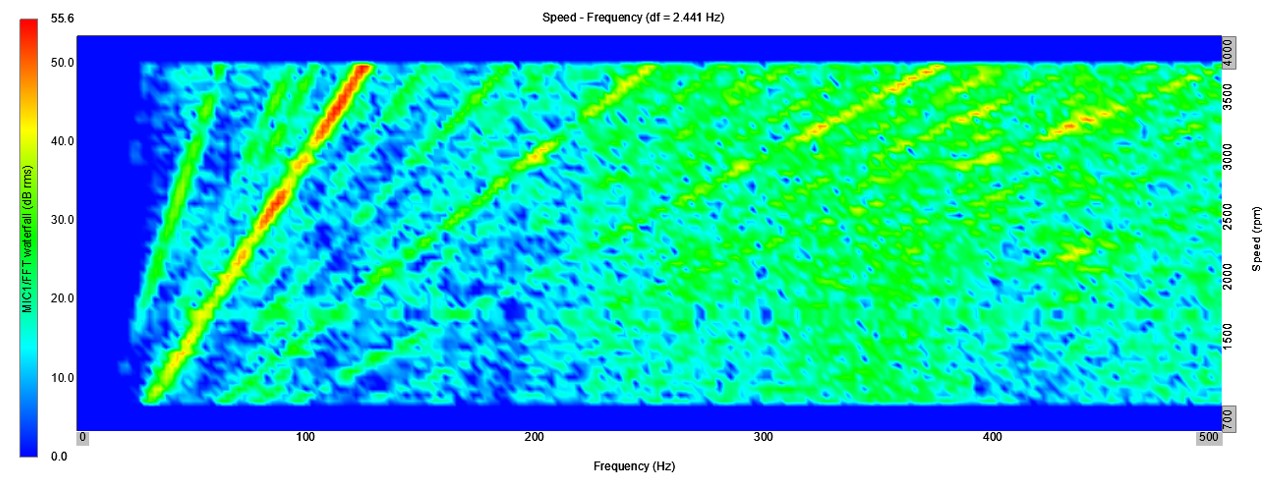
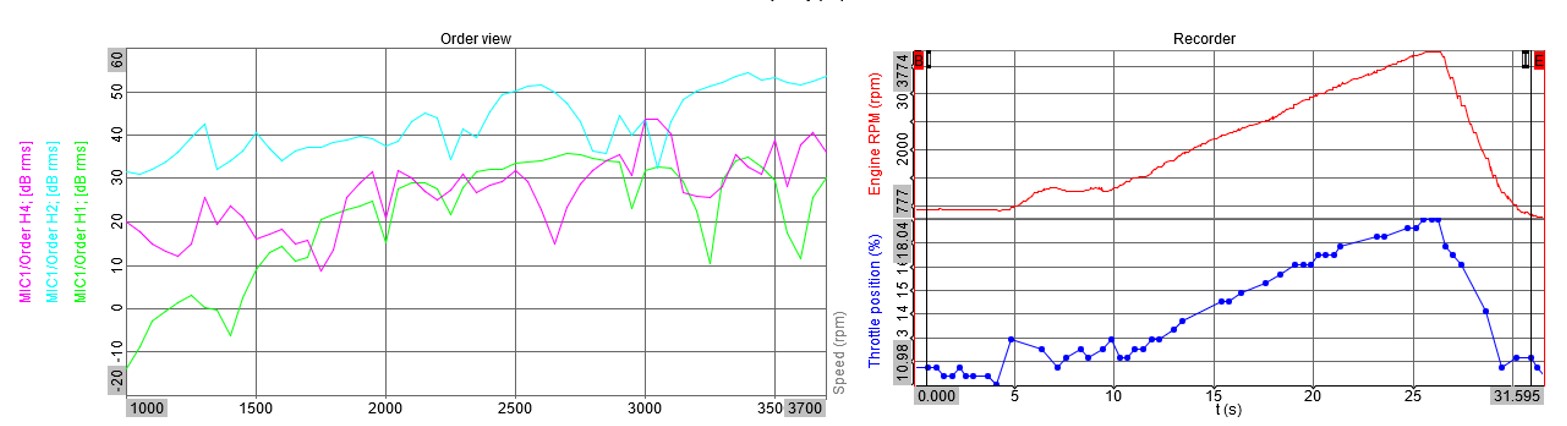
Powertrain Noise:
At ARC we are able to log vehicle data from the on-board CAN Bus. This allows us to collect data from a wide range of vehicle systems, in particular, engine RPM. Using this data, we can analyse powertrain NVH performance with order tracking techniques. The measurements detailed below are taken with a Part-Open Throttle (POT).
The graphs below show the overall acoustic spectrum in a colourmap format: We can also assess the 2nd Engine Order (2EO) noise level (this is the firing order of a 4-cylinder engine) along with the logged throttle position and engine RPM.
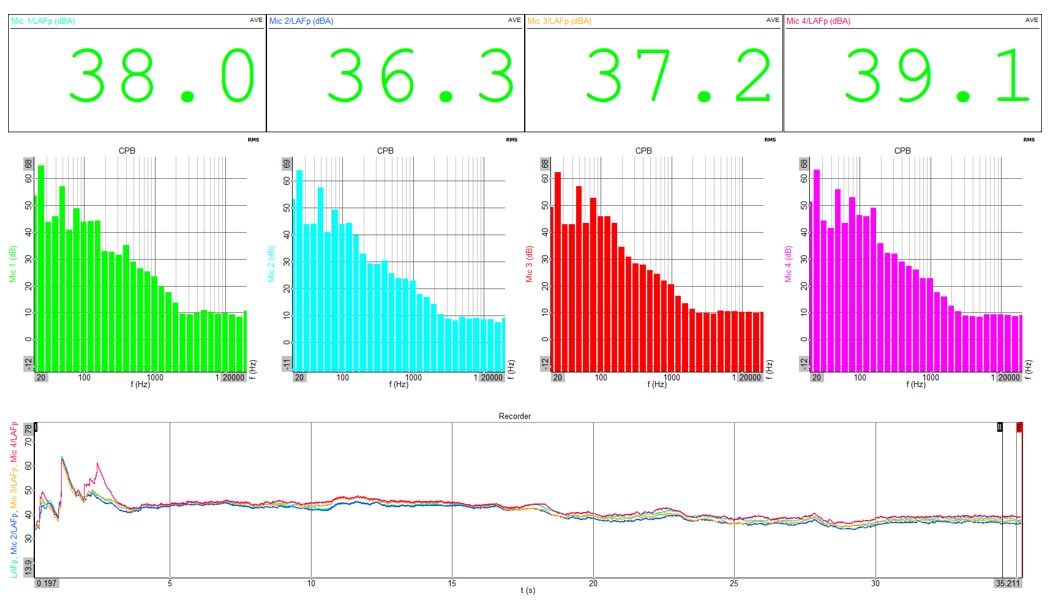
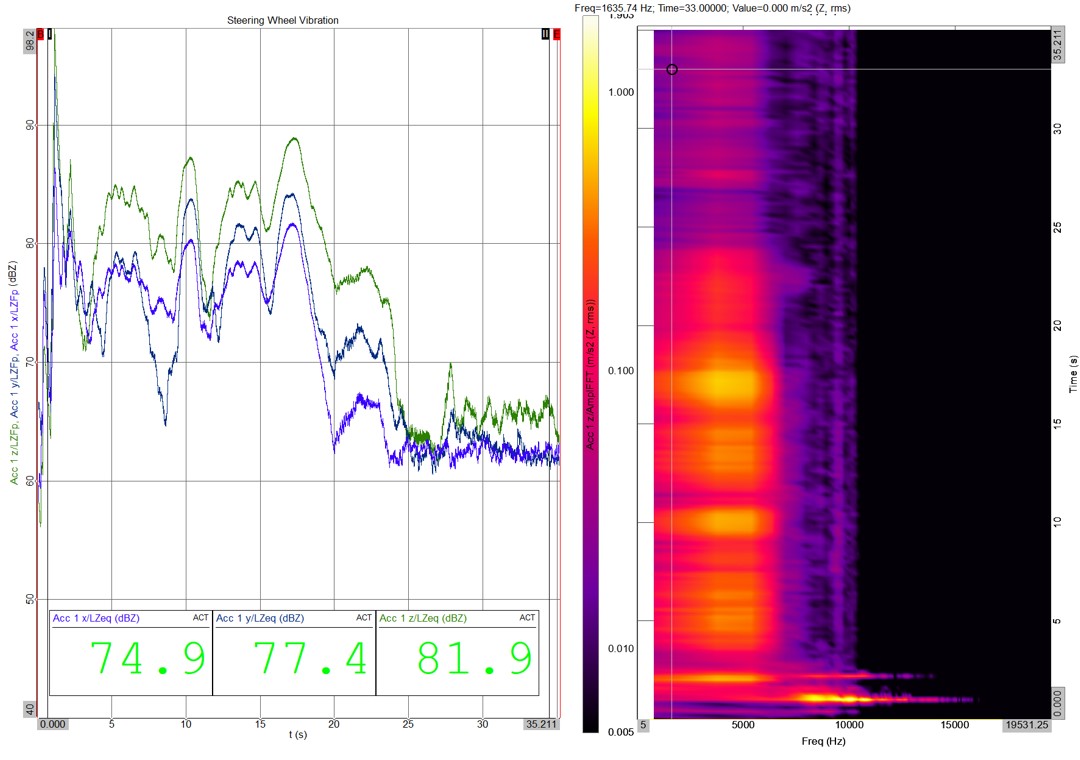
Idle Noise & Vibration
Idle Noise and Vibration are assessed using a combination of ear-position microphones and steering wheel accelerometers. The acoustic idle performance is shown in the plot below – this shows the overall SPL at each ear position, the corresponding 1/3 octave analysis and the logged time-history, so the idle behaviour following key-on can be assessed.
The idle vibration performance is shown below, as assess tri-axially on the steering wheel. In order to provide representative levels, the vibration data has been weighted using typical human-vibration filters.
Cabin Ancillary Systems
For the assessment of cabin ancillary systems, there is a significant requirement upon sound quality along with sound pressure levels. Because of this, ARC utilise cutting edge technology in order to assess a wide range of psychoacoustic parameters in order to approximate the human response to the sound of the systems assessed. In this example, we have assessed the window regulator motor, results of which are shown below.
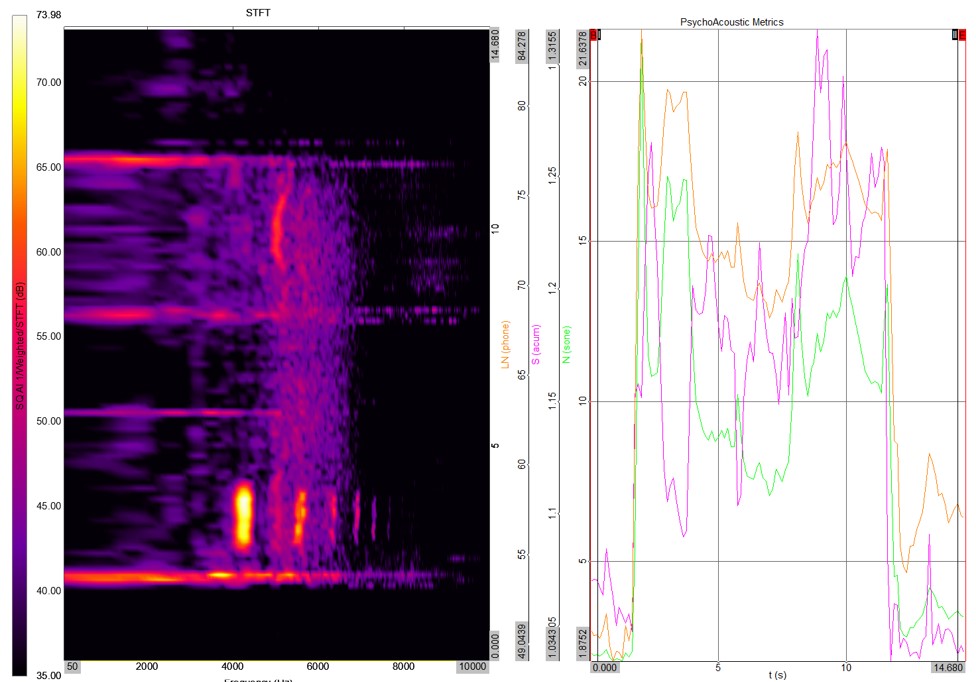
Typical psychoacoustic parameters which are assessed include: Loudness, Sharpness, Roughness, Sharpness, Fluctuation Strength and Tonality / Prominence Ratio.
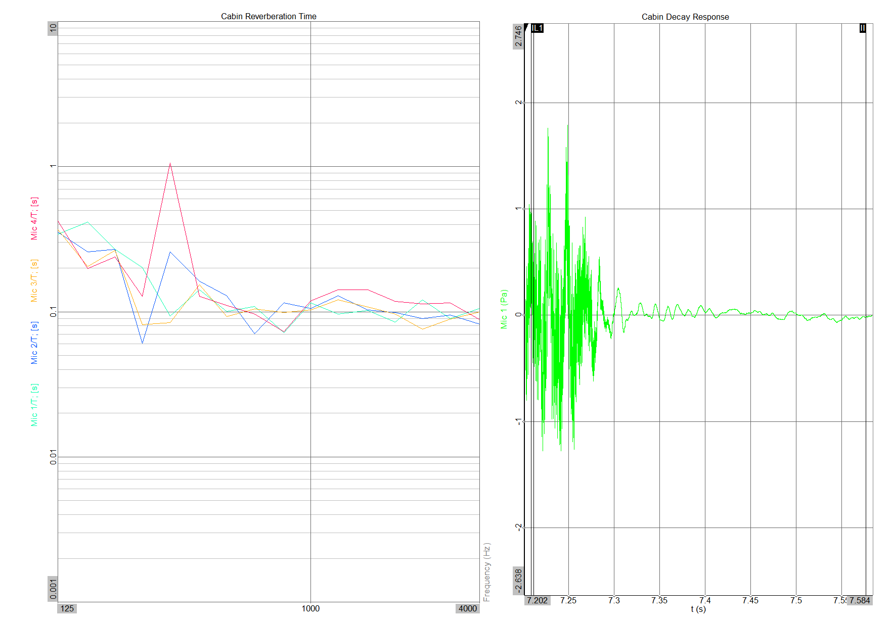
Cabin Reverberation Time (RT60)
The acoustic reverberation within a vehicle cabin can become an issue for both audio system and NVH performance. It is therefore important to measure the amount of reverberation within vehicle cabins during development phases.
Reverberation time is measured in seconds, as is defined as the amount of time required for a sound to decay by 60dB (hence, RT60).
Below, you can see the results of the RT60 measurement completed on the VW T-Roc. This plot shows the individual RT60 response at each ear position and the corresponding time response.
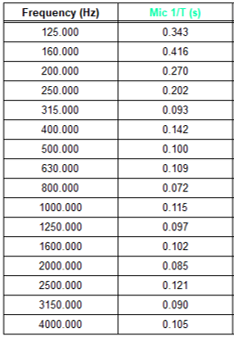
Below, you can see the tabulated results. These results are averaged across the front four ear positions within the cabin.
Ride Comfort
Ride comfort is an important aspect of NVH development. Unfortunately, the ride comfort of the VW T-Roc is below average.
At ARC, we use multiple methods to assess the ride comfort of passenger vehicles. The plot below shows the results of one of these methods - assessing the NVH performance on smooth and moderate motorway surfaces.
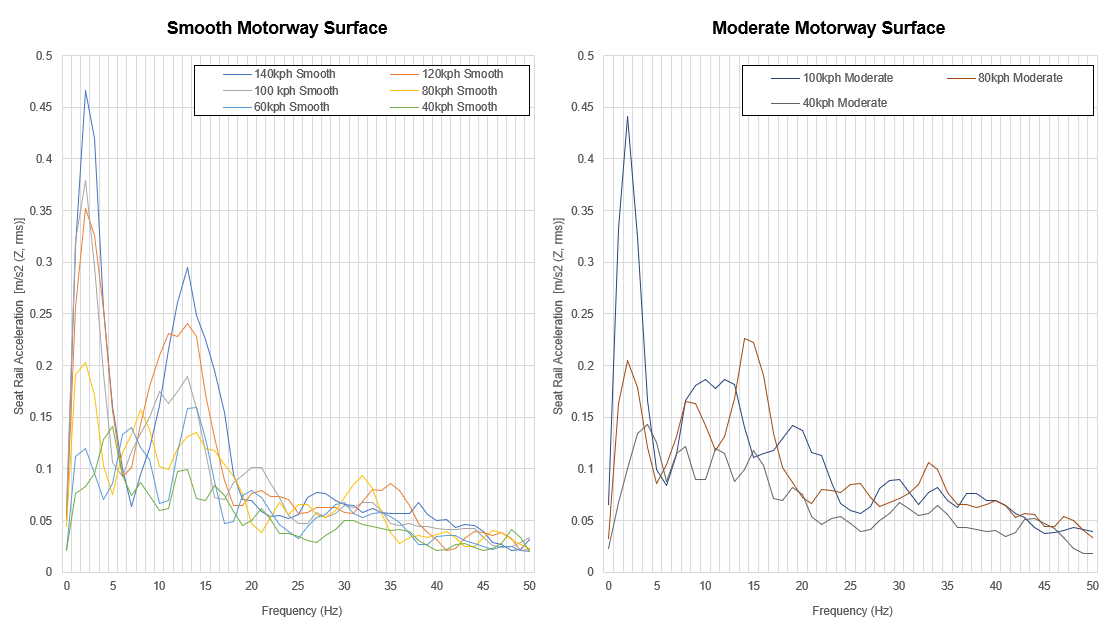
It should also be noted that these results have been weighted with the appropriate whole-body-vibration weighting factors, to give representative results which reflect the customer experience of the ride within the vehicle.
For more information about ARC's NVH benchmarking services, please contact us.
PINNED POSTS
No data found
BLOG CATEGORIES
No data found